Justin Lahart is among those calling attention to the Billion Prices Project of MIT Professors Roberto Rigobon and Alberto Cavallo.
The basic idea of the Billion Prices Project is to automate search of websites around the world that report prices at which various vendors are offering to sell specific items. By comparing that price with that for the identical product posted the previous day by the same vendor, the MIT researchers obtain a measure of when and by how much each price changes. This is of interest both for economic theories about the nature of price changes and for providing up-to-date real-time assessments of broader inflation trends.
From the perspective of economic theory, one of the project’s most interesting findings is that when vendors change the price, they are more likely to make a large change rather than a small one, giving the distribution of price changes a bimodal shape. This is in contrast to earlier research using scanner sales data or individual CPI components, which had suggested that small price changes were quite common.
 |
It’s also interesting to look at the overall price indexes that come out of these data. Cavallo and Rigobon’s approach is to take an arithmetic average of all the observed price changes for each day. They then paste today’s average price change together with yesterday’s and the day before’s to get a measure of the cumulative overall price change since some base date. This differs from a measure like the consumer price index in a number of ways. Whereas the CPI tries to measure the change in price of a particular “market basket” purchased by a representative consumer, the BPP is measuring just the price changes in observed comparable items with a sample that is dynamically changing every day based on the entry and exit of products. BPP leaves out important components that the CPI tries to include, such as housing services and technological improvements, though the ways that the CPI handles these issues are imperfect and controversial. The BPP also excludes important items such as fuel, and makes no allowance for seasonal factors. On the other hand, those items covered by the BPP may be measured more accurately. A particular advantage of BPP is that it’s available daily and for countries for which other inflation measures may be particularly problematic. And despite the conceptual differences from the CPI, it seems to give a similar overall reading.
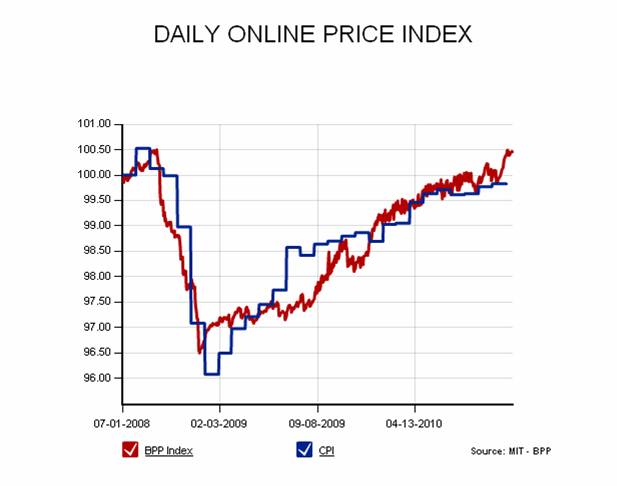 |
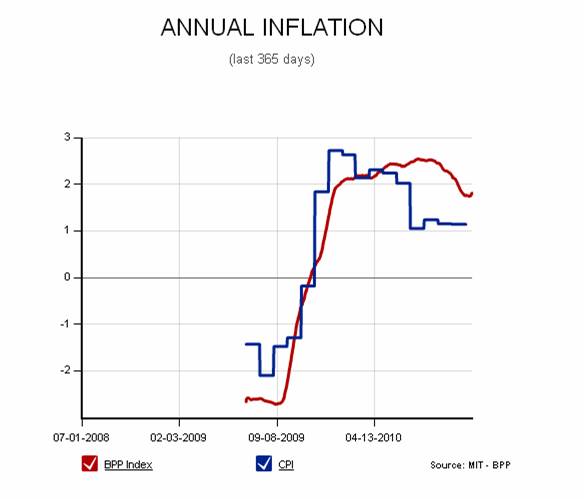
In terms of the latest trends, the BPP confirms the impression from the CPI that U.S. inflation has dropped back below 2%, though the BPP numbers have recently been tracking slightly above the CPI.
 |
JDH: Wow. Would this allow more precise modeling of flexible versus sticky prices (e.g. maybe some industries are sticky, some flexible) and also more precise modeling of the price adjustment process over time? Or have people already done such work already based on scanner data?
This has the potential to be a revolutionary development.
I do note that bpp seems to be running above CPI right now.
The BPP is above the CPI, but some of that might be attributed to the exclusion of housing from the BPP which has been falling and which constitutes about 40% of the CPI. On the other hand the BPP excludes energy which has been rising but constitutes a much smaller percentage of the CPI.
I’m a marketing guy and there has always been debate about managing prices via “smooth” (..small change..) vs “spike” (..large change..).
I sense that the large movements are actually promotional sales that are usually large spikes downward (..on sale..) then large spikes upward (..return to normal price..).
My sense is normal price movements are “smooth”
Great work…
The tricky part with automation is controlling for quantity & quality changes, any hidden fees or surcharges, and the limited observable basket of goods advertised online
This is going to be a major advance in econometrics and at some point it should earn someone, at some point, a Nobel prize for the insights obtained.
(A more cynical way to put it would be to note that it’s about time the profession entered the 21st century and started making use of the huge real-world online economic data pool!)
For what it’s worth, I think a lot of the public complaints about “inflation” reflect not so much changes in prices paid, but rather the compression in household earnings (excluding government handouts) due to high unemployment and low interest rates. People are a lot more sensitive to prices than they were back in the bubble days…
Robert Bell: There have been studies of these kinds of questions with scanner data, but this is a rich new resource.
George: From Cavallo’s paper: “Along with the price and product characteristics, retailers show an id for each product in the
page’s code (typically not visible when the page is displayed to the customer), which allows
us to uniquely identify each product over time.”
Looking at the histogram, it seems to me that the bi- modal shape is related more to an asymmetry in price changes ( i.e. inflexibility to small price reductions). Large price reductions ( like temporary 10% or 15% discounts) are more likely than small ones. But the same is not true for price increases.
I took up the study of economics because it seemed that all of the interesting finance related ideas originated in economics – CAPM, Options Pricing. For better or worse.
In this case it seems that finance is leading the way however. Hedge funds have been employing web search trading-algorithms for several years now. I’m glad to see economists are now sharing in the wealth of information available thorough search.
It looks like a virtuous parenthood of the high frequency trading in the financial markets (save the fact that the daily spikes in the financial markets are more volatile than the markets in goods)
Could that satisfy the Debreu theory of market efficiency and prices convexity?
or can the virtuous parenthood be turned into a lecherous monk?
Market pricing may then be easily driven by few at the expenses of many.
Anyway very interesting model.It should be quickly introduced in a country where King is not a subject,but the monetary policy is.
Bloomberg
Bank of England Governor Mervyn King said inflation will remain “elevated” throughout 2011 after it unexpectedly accelerated in October, forcing him to write the fourth letter of explanation to the Treasury this year.
I believe that Google are also working on an inflation index based on online prices…
Professor,
I am probably just too thick to find it but what do they use as their base year?
Also how can we get this summarized into a world inflation number? Countries have always understood that inflation within a country was a problem. Today with transportation improvements and communication improvements the world has become closer to what were countries in the past. That means an analysis or worldwide inflation could be instructive.
This is often a major confusion when currency values are analyzed. They are measured agains another currency when both may be in significant inflation.
Ricardo: In the CPI, the base year matters because that is the date for which the “market basket” is defined. In BPP, the base year is irrelevant, because each day there is a different universe of items that enter the index. If you want to interpret the level of the U.S. BPP index, it looks from the graph like that’s normalized at July 2008 = 100.
The authors construct a separate index for each country. You could combine the indexes across countries in whatever way you see fit.
Hal Varian gave a presentation last month at a FRB Philadelphia workshop where, among other things, he pushed the use of Google Trends/Google Insights for real-time monitoring of the economy. He mentioned work on price index construction using prices reported through the Google Shopping database. As far as I recall
– only quite short time-series were available
– there was no good information on what CPI components were covered
– there was no reference to any formal working paper